VisuallyMeta
← Work

Case study

Agentic AI Voice Platform

shipped

A platform for building, deploying and managing AI voice agents that handle real customer calls.

Role
Product Designer
Outcome
Product is live and already achieved successful deployment for 20+ Clients in 2 months.
When
15 Jun 2026 — 31 Jul 2026
Agentic AI Voice Platform

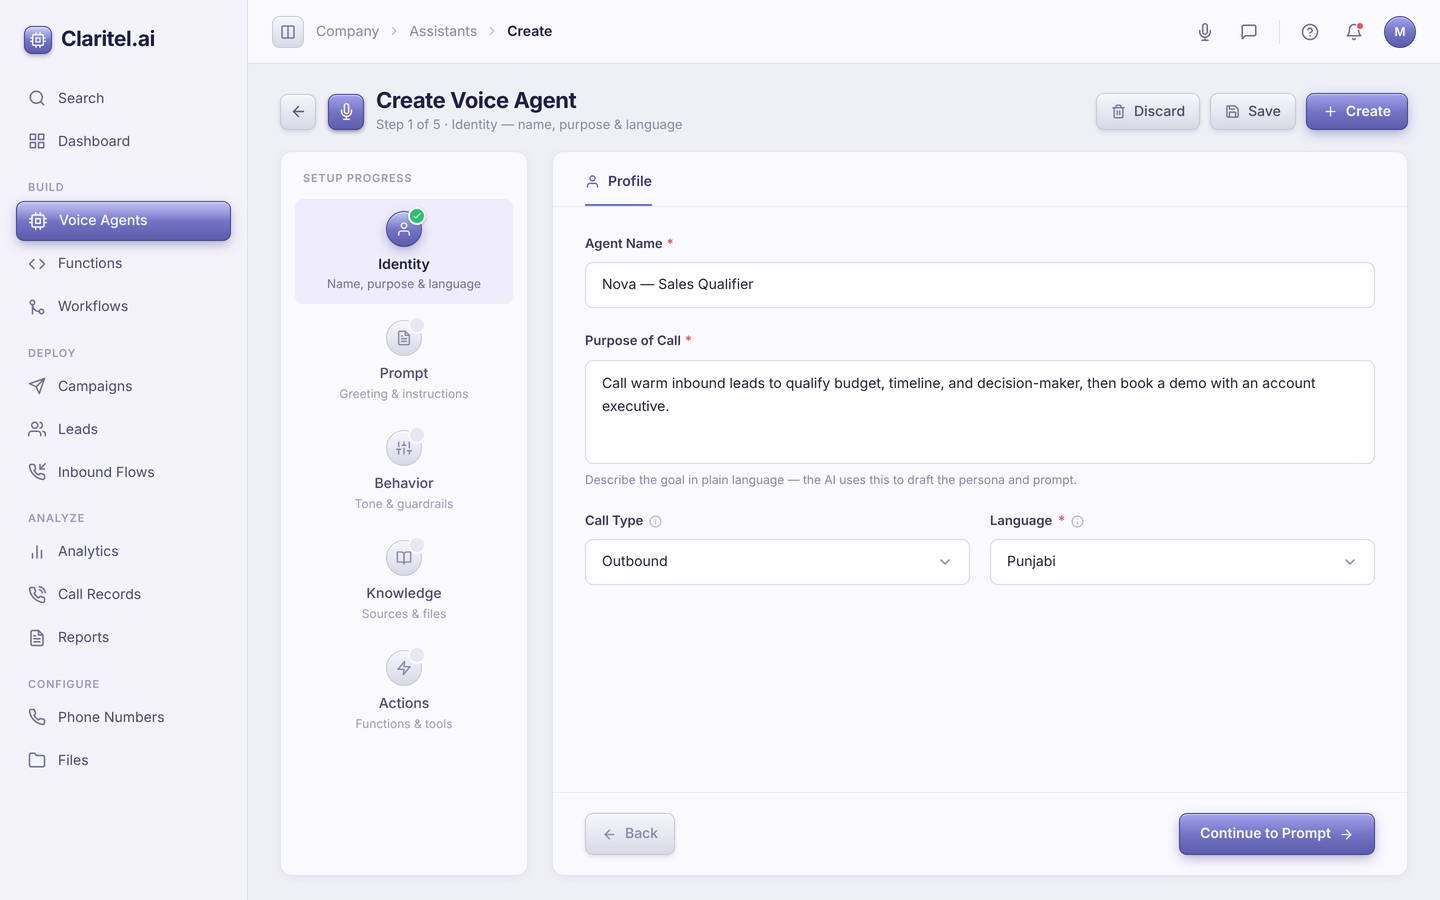
Clara lets businesses run AI voice agents alongside or instead of human agents, for inbound support, outbound campaigns and collections. The suite also includes chat bots, agent assist and voice-of-customer modules. The design challenge was making agentic AI configurable and observable for operations teams who aren't AI specialists. They need to know what the bot will say, why it did what it did, and when to step in. I worked on the platform's UX and information architecture, using a Figma-to-code workflow with AI tooling built into the design process.

My role: UX design, information architecture, design-to-code pipeline.

Project log

  1. Working on Clara

    Sat down with the product expert to map out Clara from scratch — user flows, feature set, the full architecture of an Agentic AI Voice platform. The kind of session where you walk in with assumptions and walk out with a completely different mental model of what the product needs to be.

  2. Onboarding for Clara

    Designed this onboarding screen for Clara — and the process is worth talking about more than the output. I used Claude Code to build the frontend directly, pulling inspiration and code from ReactBits. No Figma first. No handoff. Just straight from idea to working interface. The workflow is shifting, and I'm leaning into it.

  3. Designed the Information Architecture

    Working on a user flow is one thing. Refining its information architecture — stress-testing every button, every feature, the core flow itself against our requirements — is another entirely. There was a lot to fine-tune. It felt like designing a car, then making sure people could actually open the door, sit down, and drive.

  4. Starting with Clara Design

    Now that the information architecture is done and the full flow has been shared with every stakeholder — feedback folded in, use cases refined — I've started fine-tuning the design against our brand guide.

    The setup was half the fun: I connected the Figma plugin to Claude Code and handed over my design file, which it read and turned into a clean Markdown reference for Claritel's brand colors.

    Then I fed that same design file back into Claude Code and got to work. I also brought in Wonder — an AI-first design app — and was able to generate design directly from my inputs. A few skills pulled the weight along the way: emilkowalski/skill, /impeccable init, and Leonxlnx/taste-skill.

    Hope to share the result soon.

  5. Analytics: Clara Dashboard

    We started on flat, comfortable ground. The scope for Analytics was strong — clean charts, solid metrics, everything a dashboard is supposed to have. We felt good. The line was steady and high.

    Then we fell into the hole.

    The problem was quiet at first, easy to miss: we had designed the whole thing from our side of the glass. We were thinking like people who build charts, not like people who live with results. And a customer who has run their Agentic AI Voice Platform for a month doesn't open Analytics to admire charts. They walk in carrying real weight — business questions:

    "Is my AI actually helping my business?"
    "Where am I losing opportunities?"
    "How can I improve my agents and campaigns?"

    Our beautiful scope had no answer to any of that. That was the bottom of the hole.

    Climbing out meant flipping the entire frame — designing for the people who'd actually use it, and more specifically, for the perspective each person brings based on their job:

    • The campaign / operations manager — "Is it working?"
    • The sales / growth owner — "Am I making money?"
    • The inbound / support lead — "Are we dropping the ball?"
    • The product / AI owner — "Does it feel good to the caller?"

    Once the questions led the design instead of the charts, everything reorganized around them. We came out of the hole standing higher than where we started — not with a prettier dashboard, but with one that actually answers for itself.
Next projectAutomated Quality Management →