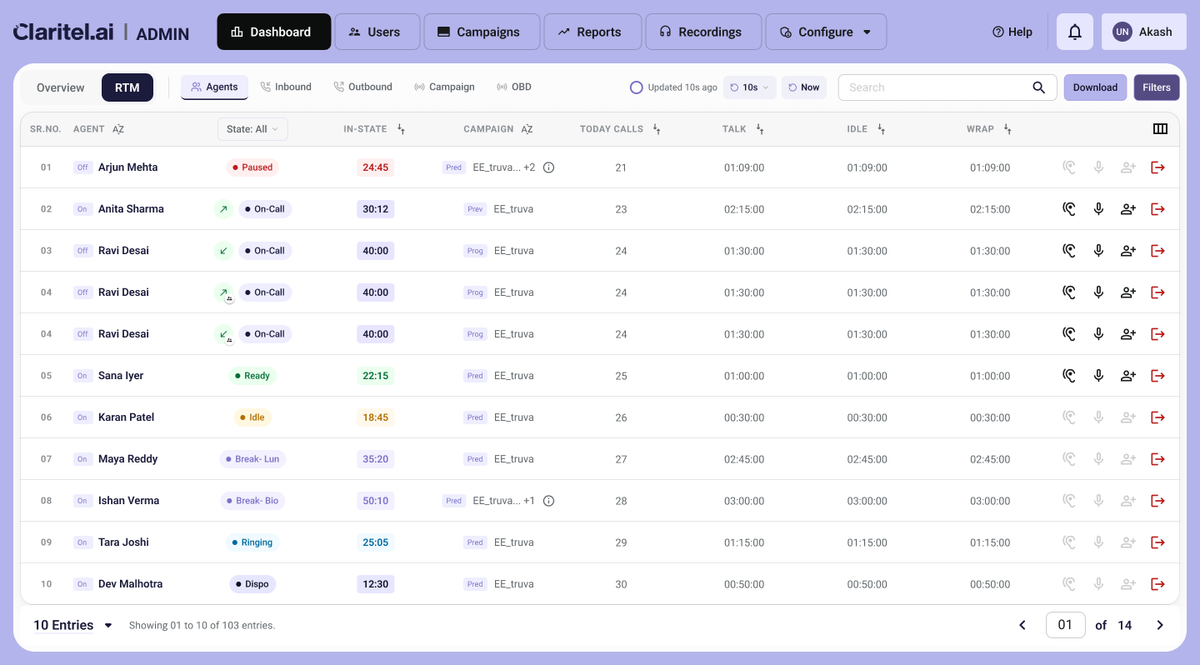
What happened: I showed clients the redesigned monitoring dashboard: an Overview tab full of charts, and an RTM tab with five sub-tabs (Agents, Inbound, Outbound, Campaign, OBD). The Overview tab got almost no reaction. RTM got all the questions.
What they actually asked for:
Which agents are idle right now?
Who has been on an unusually long call?
Which campaigns have run out of leads?
Filter inbound calls by queue status.
Supervisors didn't want to see how the day was going. They wanted to know what needed their attention right now.
What changed:
A right-side drawer for each row in Agents, Inbound, Outbound and Campaigns, with live actions in it: Monitor, Whisper, Barge.
Advanced filters for each tab, with an estimated record count shown before the filter is applied. Supervisors can see the size of a query first, which also keeps API calls efficient.
Workflow note: Screens were built in HTML with Claude Code first, then ported into Figma for refinement.